| Pittsburgh | 7 | at | Montreal | 6 (OT) |
| All times below are based on data from NHL.com. |
NHL.com links: |
|
|
|
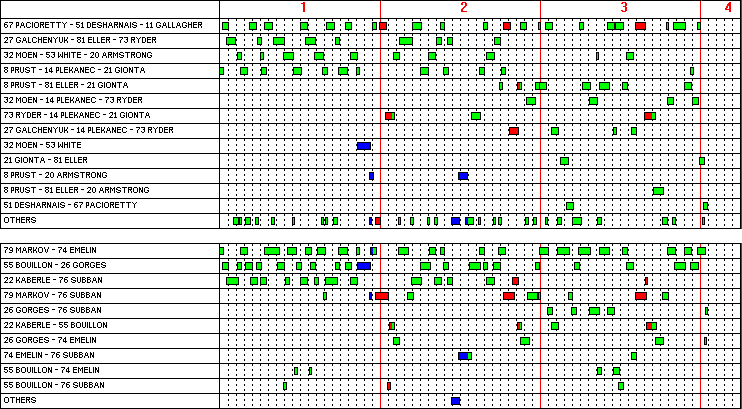
Line match-ups:
| Line/Pair | 67MP 51DD 11BG |
27AG 81LE 73MR |
32TM 53RW 20CA |
8BP 14TP 21BG |
8BP 81LE 21BG |
32TM 14TP 73MR |
73MR 14TP 21BG |
27AG 14TP 73MR |
79AM 74AE |
55FB 26JG |
22TK 76PS |
79AM 76PS |
26JG 76PS |
22TK 55FB |
26JG 74AE |
|
| 9 Dupuis - 87 Crosby - 14 Kunitz | 1:44 | 0:49 | 1:46 | 3:31 | 3:11 | 2:02 | 9:46 | 2:49 | 0:05 | 0:47 | 0:10 | 0:47 | ||||
| 18 Neal - 16 Sutter - 24 Cooke | 4:38 | 0:41 | 1:01 | 1:29 | 0:12 | 0:58 | 1:28 | 3:45 | 1:45 | 0:13 | 2:04 | |||||
| 48 Kennedy - 15 Jeffrey - 19 Bennett | 1:09 | 2:28 | 1:06 | 0:17 | 0:09 | 0:48 | 0:42 | 1:03 | 3:38 | 0:30 | ||||||
| 10 Glass - 46 Vitale - 27 Adams | 1:07 | 1:34 | 0:51 | 0:27 | 0:30 | 1:08 | 2:34 | 0:04 | ||||||||
| 14 Kunitz - 87 Crosby - 18 Neal | 0:06 | 0:06 | 1:24 | 0:11 | 1:01 | |||||||||||
| 44 Orpik - 58 Letang | 4:31 | 2:42 | 1:32 | 4:10 | 0:53 | 0:39 | 0:03 | 7:01 | 2:37 | 2:18 | 4:27 | 0:27 | 0:20 | |||
| 2 Niskanen - 4 Eaton | 3:40 | 2:32 | 1:09 | 0:21 | 0:28 | 2:04 | 1:00 | 1:46 | 2:27 | 4:56 | 1:05 | 1:27 | 0:02 | |||
| 5 Engelland - 47 Despres | 2:01 | 1:18 | 2:15 | 0:40 | 0:41 | 1:35 | 1:58 | 1:52 | 0:38 | 0:51 | 2:10 | |||||
| 2 Niskanen - 47 Despres | 0:52 | 0:40 | 0:27 | 0:26 | 1:01 | 1:07 | 0:12 | 0:47 | 0:08 | |||||||
| 4 Eaton - 58 Letang | 0:36 | 0:04 | 1:56 | 0:20 | 0:06 | 2:40 | 0:20 | 0:06 | ||||||||
| 2 Niskanen - 58 Letang | 0:16 | 0:12 | 0:26 | 1:36 | 0:10 | |||||||||||
| 2 Niskanen - 44 Orpik | 0:40 | 0:14 | 1:13 | 0:26 | 1:20 | 0:21 | 0:33 | 0:31 | ||||||||
| 5 Engelland - 44 Orpik | 0:32 | 0:09 | 0:15 | 0:25 | 0:04 | 0:23 | 0:18 | 0:16 | 1:17 | |||||||
Shift chart:
(green = even-strength, red = power-play, blue = short-handed)
For each forward: most common linemates
(as a percentage of total ice time)
8 Prust
| 11 Gallagher
| ||||||||||||||||||||||||||||||||||||||||||||||||||||||||||||||||||||||||||||||||||||||||||||||||||
14 Plekanec
| 20 Armstrong
| ||||||||||||||||||||||||||||||||||||||||||||||||||||||||||||||||||||||||||||||||||||||||||||||||||
21 Gionta
| 27 Galchenyuk
| ||||||||||||||||||||||||||||||||||||||||||||||||||||||||||||||||||||||||||||||||||||||||||||||||||
32 Moen
| 51 Desharnais
| ||||||||||||||||||||||||||||||||||||||||||||||||||||||||||||||||||||||||||||||||||||||||||||||||||
53 White
| 67 Pacioretty
| ||||||||||||||||||||||||||||||||||||||||||||||||||||||||||||||||||||||||||||||||||||||||||||||||||
73 Ryder
| 81 Eller
|
For each D-man: most common partners
(as a percentage of total ice time)
22 Kaberle
| 26 Gorges
| ||||||||||||||||||||||||||||||||||||||||||||||||||||||||||||||||||||||||||
55 Bouillon
| 74 Emelin
| ||||||||||||||||||||||||||||||||||||||||||||||||||||||||||||||||||||||||||
76 Subban
| 79 Markov
|