| Nashville | 2 | at | Montreal | 1 |
| All times below are based on data from NHL.com. |
NHL.com links: |
|
|
|
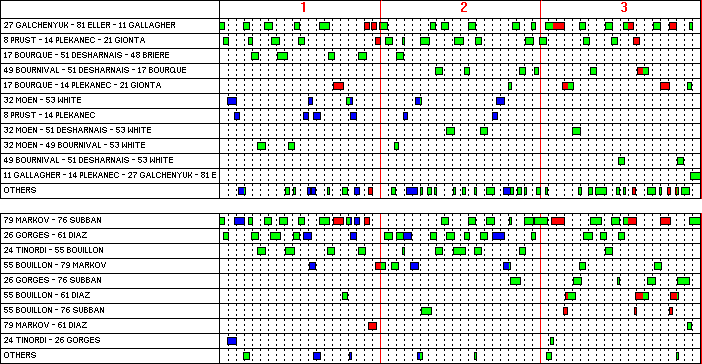
Line match-ups:
| Line/Pair | 27AG 81LE 11BG |
8BP 14TP 21BG |
17RB 51DD 48DB |
49MB 51DD 17RB |
17RB 14TP 21BG |
32TM 53RW |
8BP 14TP |
32TM 51DD 53RW |
79AM 76PS |
26JG 61RD |
24JT 55FB |
55FB 79AM |
26JG 76PS |
55FB 61RD |
|
| 57 Bourque - 7 Cullen - 15 Smith | 2:44 | 1:41 | 0:48 | 0:42 | 0:27 | 0:33 | 3:44 | 2:12 | 0:21 | 0:39 | 0:23 | 1:11 | |||
| 25 Stalberg - 28 Gaustad - 26 Hendricks | 2:07 | 1:50 | 0:28 | 0:09 | 1:12 | 0:28 | 3:36 | 0:47 | 0:29 | ||||||
| 33 Wilson - 11 Legwand - 27 Hornqvist | 1:44 | 1:10 | 0:26 | 1:08 | 0:30 | 1:47 | 3:34 | 0:37 | 0:57 | ||||||
| 9 Forsberg - 11 Legwand - 27 Hornqvist | 0:21 | 0:12 | 0:15 | 2:35 | 1:13 | 2:16 | 0:48 | 0:29 | |||||||
| 24 Nystrom - 13 Spaling - 9 Forsberg | 0:13 | 2:49 | 0:42 | 0:44 | 0:30 | 1:50 | 2:19 | 1:03 | 0:02 | ||||||
| 57 Bourque - 7 Cullen - 15 Smith - 33 Wilson | 2:19 | 0:26 | 1:21 | 0:50 | |||||||||||
| 26 Hendricks - 28 Gaustad | 2:01 | 0:11 | 0:34 | 0:30 | 2:32 | 0:45 | |||||||||
| 24 Nystrom - 13 Spaling | 0:28 | 0:18 | 1:17 | 1:28 | 0:23 | ||||||||||
| 3 Jones - 6 Weber | 8:56 | 3:50 | 0:14 | 1:18 | 1:50 | 0:21 | 2:35 | 0:33 | 10:14 | 4:14 | 2:25 | 2:59 | 1:54 | 1:22 | |
| 8 Klein - 42 Ekholm | 3:06 | 4:06 | 1:02 | 0:40 | 1:52 | 0:57 | 4:56 | 3:52 | 2:32 | 0:07 | 1:52 | 1:29 | |||
| 4 Ellis - 64 Bartley | 0:25 | 0:17 | 2:20 | 1:27 | 0:30 | 1:44 | 2:59 | 1:52 | 0:15 | ||||||
| 4 Ellis | 2:19 | 0:26 | 1:19 | 0:36 | |||||||||||
| 6 Weber - 8 Klein | 0:34 | 0:17 | 1:12 | 0:25 | 0:24 | ||||||||||
Shift chart:
(green = even-strength, red = power-play, blue = short-handed)
For each forward: most common linemates
(as a percentage of total ice time)
8 Prust
| 11 Gallagher
| ||||||||||||||||||||||||||||||||||||||||||||||||||||||||||||||||||||||||||||||||||||||||||||||||||
14 Plekanec
| 17 Bourque
| ||||||||||||||||||||||||||||||||||||||||||||||||||||||||||||||||||||||||||||||||||||||||||||||||||
21 Gionta
| 27 Galchenyuk
| ||||||||||||||||||||||||||||||||||||||||||||||||||||||||||||||||||||||||||||||||||||||||||||||||||
32 Moen
| 48 Briere
| ||||||||||||||||||||||||||||||||||||||||||||||||||||||||||||||||||||||||||||||||||||||||||||||||||
49 Bournival
| 51 Desharnais
| ||||||||||||||||||||||||||||||||||||||||||||||||||||||||||||||||||||||||||||||||||||||||||||||||||
53 White
| 81 Eller
|
For each D-man: most common partners
(as a percentage of total ice time)
24 Tinordi
| 26 Gorges
| |||||||||||||||||||||||||||||||||||||||||||||||||||||||||||||||||||||||||||||||||||||||||||||||||
55 Bouillon
| 61 Diaz
| |||||||||||||||||||||||||||||||||||||||||||||||||||||||||||||||||||||||||||||||||||||||||||||||||
76 Subban
| 79 Markov
|