
Week 1
Project's Aim
The public transport play an important role in reducing congestion, improving economic productivity, and protecting our environment by providing an alternative means of travel to private vehicles. Fredericton Transit provides public transit services for people living in the urban and suburban areas of the City of Fredericton. However, a recent survey shown that there are some issues needed to address to offer better services for the Fredericton's citizen.
Summary of key points and findings from this recent survey:
Therefore, the aim of this project is to use GIS to analyze the data and producing some insights for the purpose of imrproving the public transit services in Fredericton.
Supervisor
Dr. Emanuel Stefanakis
Group members:
Hung Cao
Tentative Plan:
-------------------------------------------------------
Week 2
Datasets
The data that are used in this project is mainly retrieved from the open source data provided by the City of Fredericton. They include the following datasets:
- Fredericton's Building footprints [data] [Metadata]
- Street Centerline Segments represent each street in the City of Fredericton [data] [Metadata]
- Fredericton Demographics [data] [Metadata]
- All bus routes of Fredection City [data] [Metadata]:
- All bus stops in the Fredericton Transit network [data] [Metadata]
- Fredericton Traffic Signals [data] [Metadata]
- Fredericton Traffic Accidents [data] [metadata]
-------------------------------------------------------
Week 3
Data processing
Dring this week, some basic data preparation and data processing tasks are conducted. The detailed of each task is listed as follows:
- Task 1: Prepare and processing the bus stop data provided by the City of Fredericton.
- Task 2: Prepare and processing the bus route, street centre line data as well as and building footprint data collected from Fredericton Transit and the City of Fredericton
- Task 3: Dealing with the demographics data of the City of Fredericton
- Task 4: Prepare the data of traffic signal of the City of Fredericton
- Task 5: Prepare and processing the traffic accident in Fredericton from 2007 - 2018
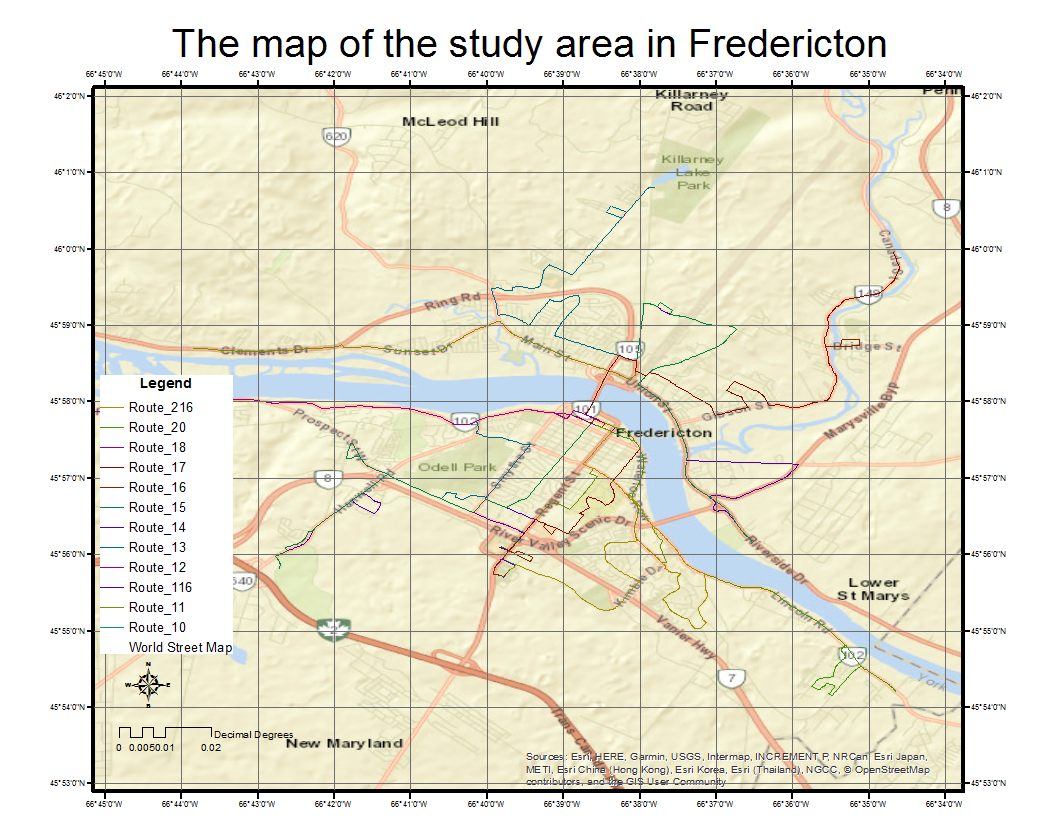
Task 1: To deal with the bus stop data, we have collected, processed and created a map showing all the bus stops over the City of Fredericton. We classified the bus stops based on the type. There are five main types including:
- Bus stop with Decorative
- Bus stop with Shelter
- Bus stop with Shelter with Metal Pole
- Bus stop with Standard on Metal Pole
- Bus stop with Standard on Wooden Pole
We also plotted all the bus routes in this map, so that we can easily anaylize the bus stops belong to each bus route. In general, most of the bus stops in Fredericton are the Standard on Metal Pole. Only a few bus stops are the Shelter and Decorative. The bus stop with the Standard on Woolden Pole are mainly distributed the surburb area (i.e.: Bus Stops in Bus Route 20 - Lincoln Segment, Bus Stops in Bus Route 16/17 - Gibson Segment to Canada Street Segment, Bus Stops in Bus Route 10/11 - Sunset Drive Segment to Clementive Drive Segment)

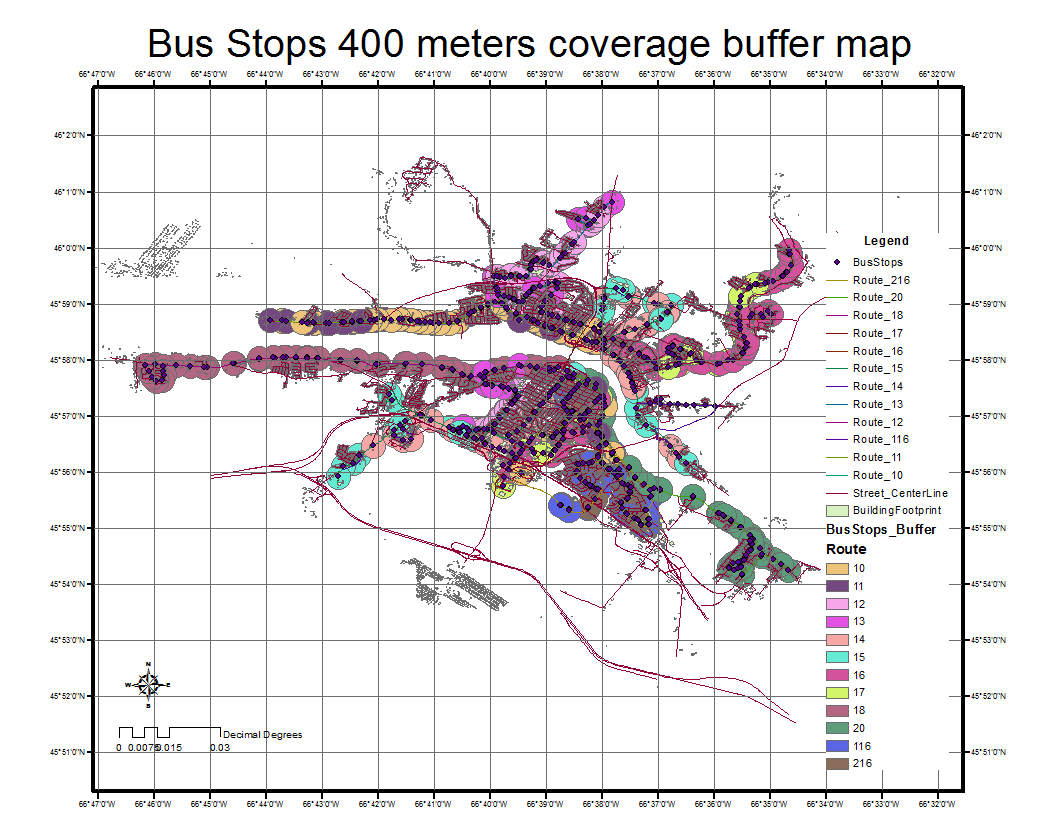
Task 2: To deal with the bus stop, bus route, street centre line data as well as and building footprint data we have collected, processed and created a map showing all the bus stops' buffers over the City of Fredericton. The map below shows the 400m catchment areas of all bus stops in Fredericton. Generally, it can be seen from the map that the distance between 2 bus stops is very close, since there are many overlap between bus stop's buffers. The high density is not always good for the bus operation performance, it is, instead, sometime create many problems such as delays, resouce wasting and highly management costs. From this basic map, other analysis may be conducted in the week 4. :
Task 3: We have collected and processed the demographics data of the City of Fredericton. The map below shows the population density in Fredericton:
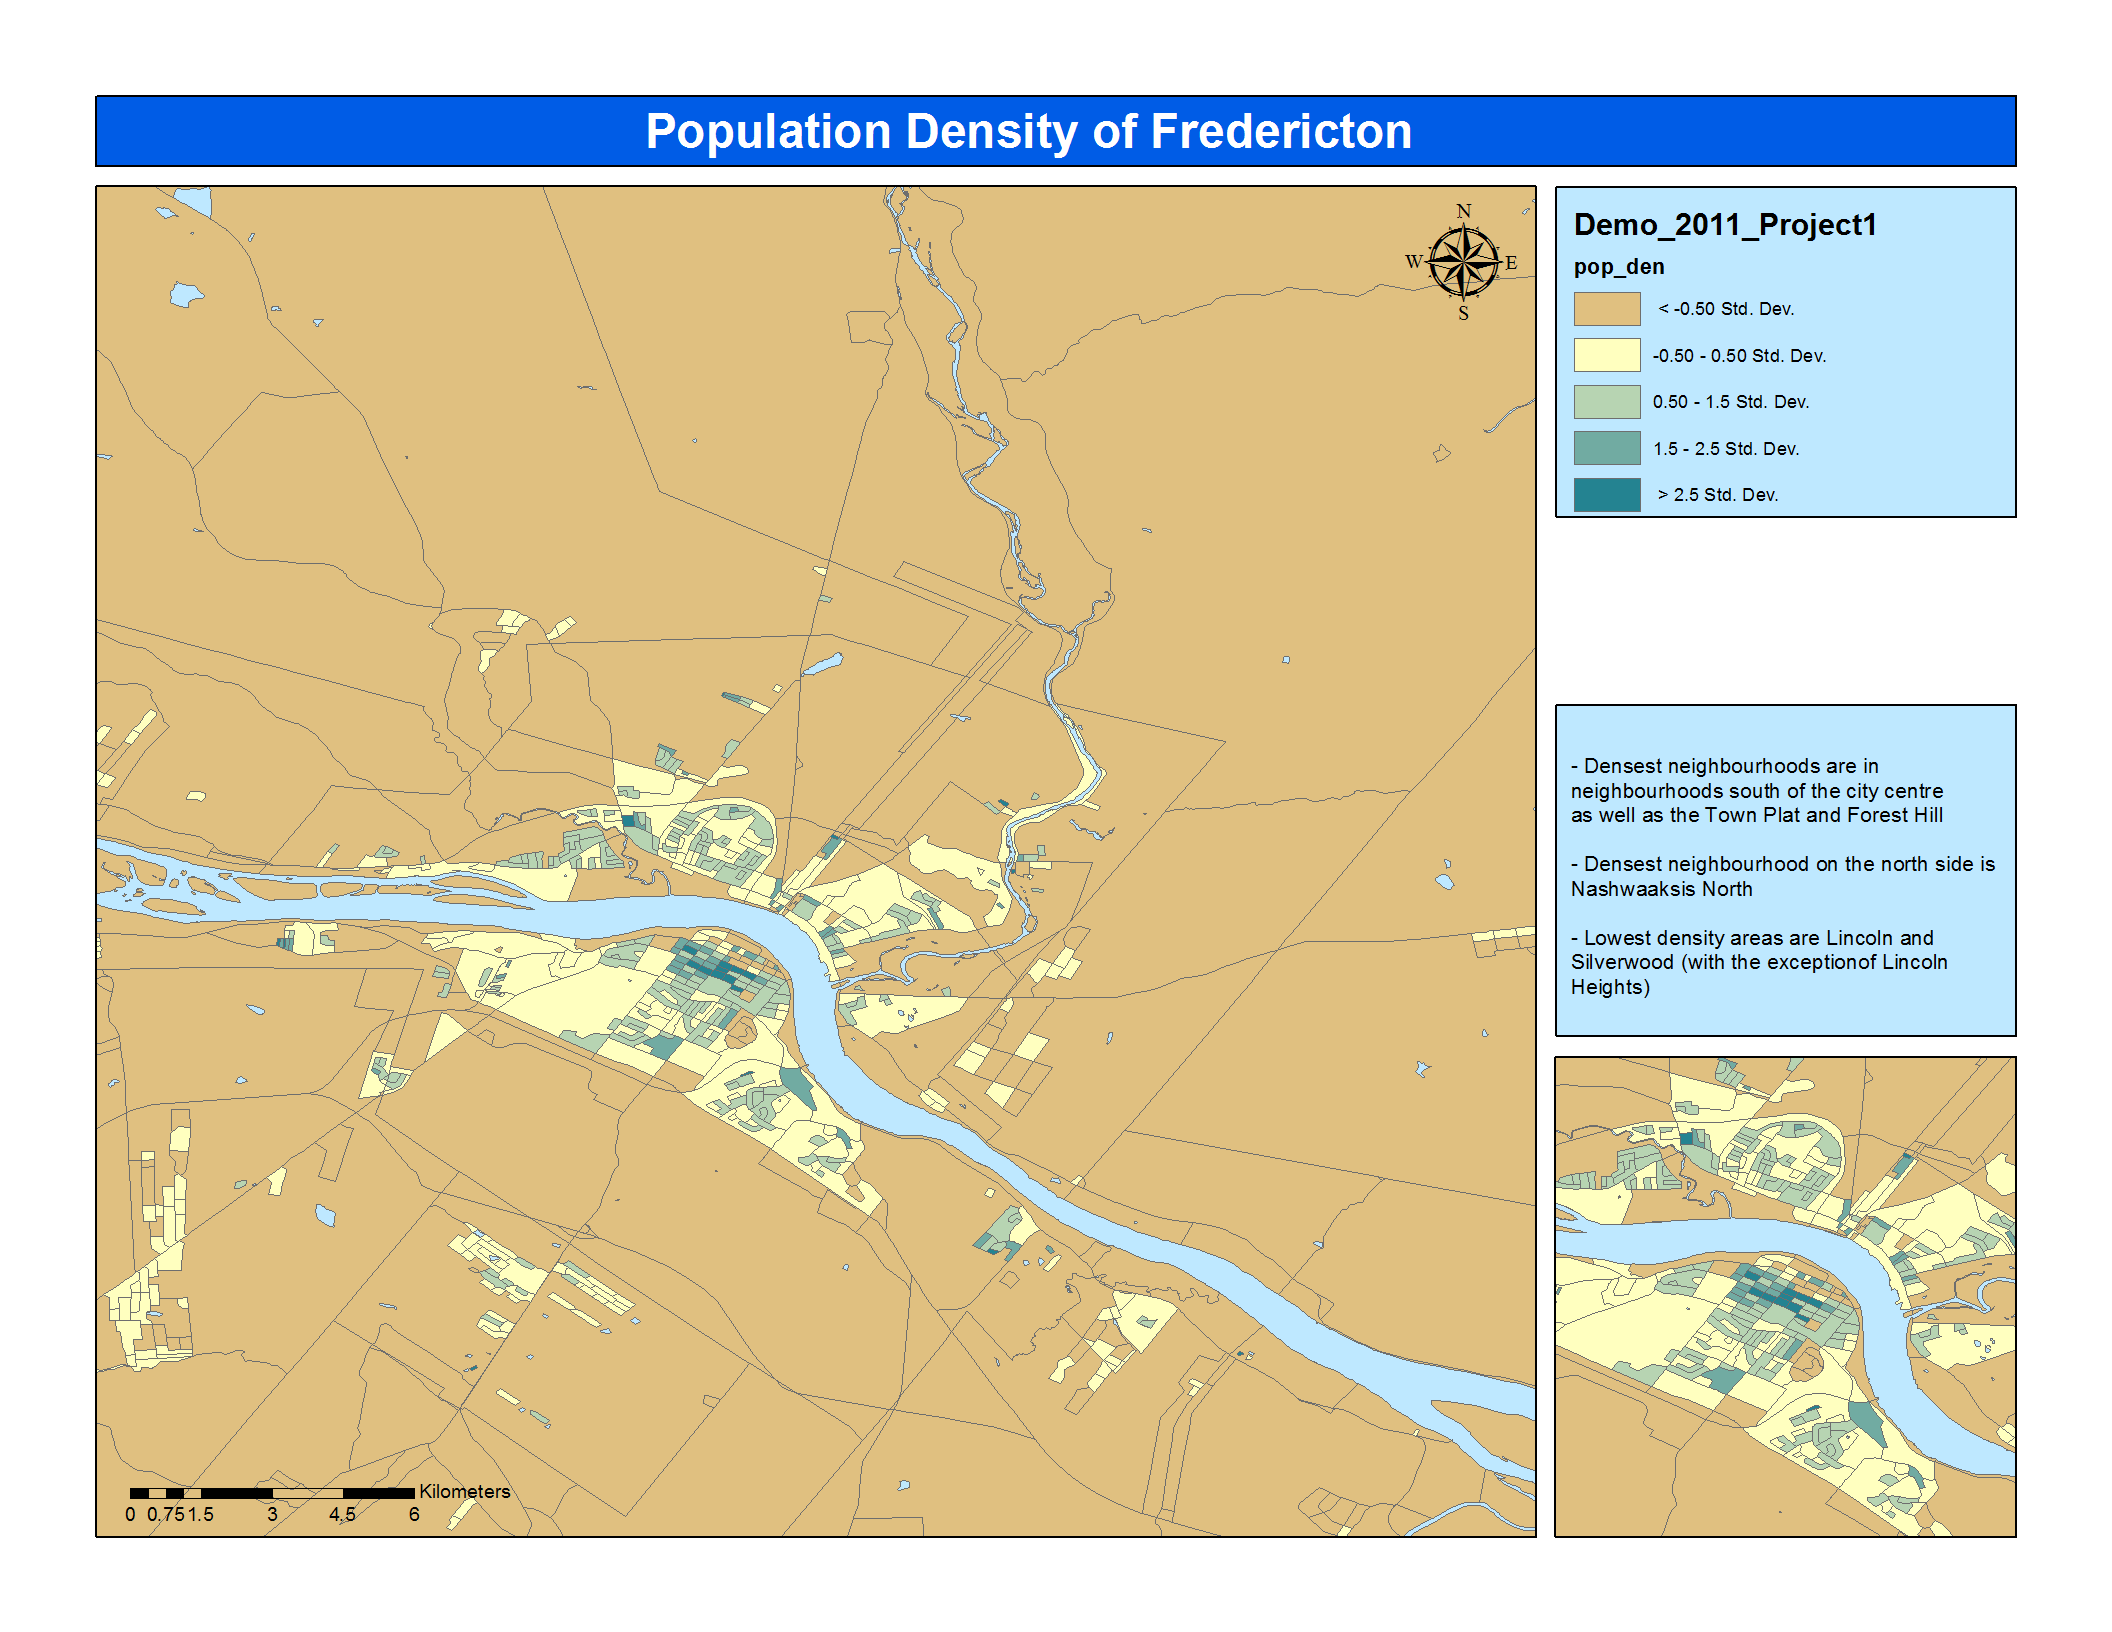
There are several initial observations from the map:
- The neighbourhoods south of the city centre as well as the Town Plat and Forest Hill have the highest population density
- Highest density area on the north side is Nashwaaksis North
- Lowest density areas are Lincoln and Silverwood (with the exception of Lincoln Heights)
Further analysis will be conducted in week 4.
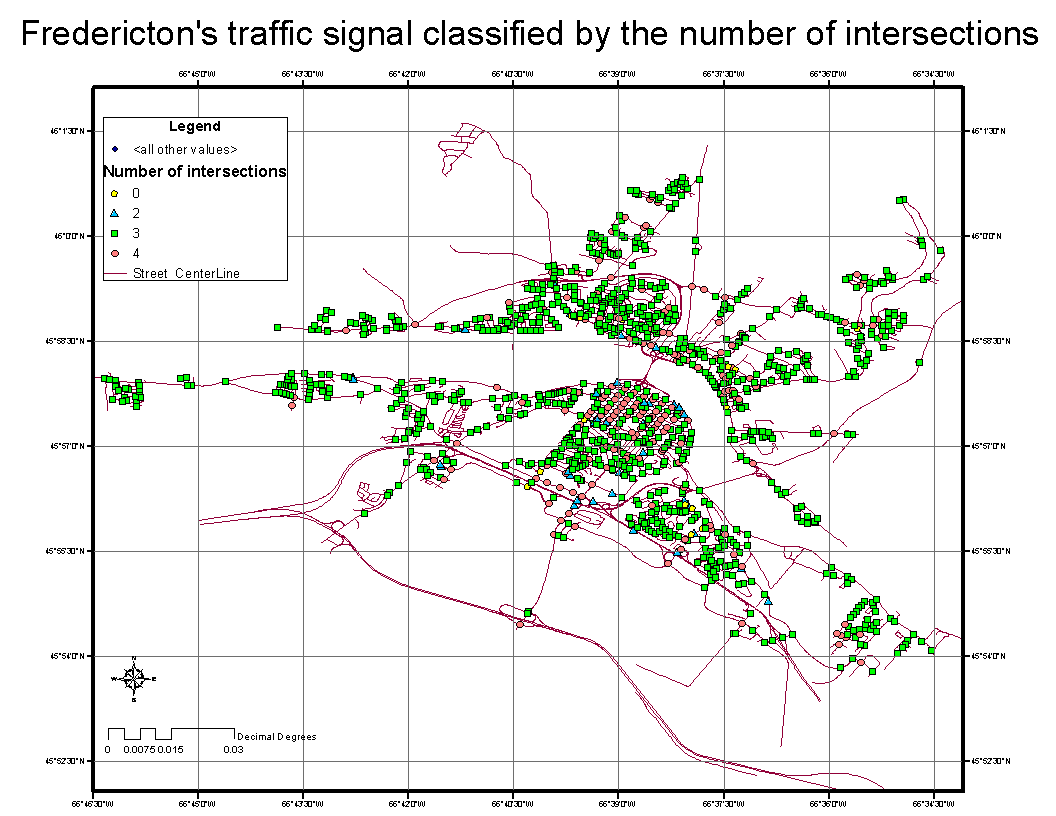
Task 4: The data of traffic signal of the City of Fredericton may useful for us to analyse the performance of each bus route and how may the traffic signal affect to bus service? (e.g: the more intersections a bus route pass, the longer service time it can be took) Therefore, we plotted all of the Fredericton traffic signal classified by the number of intersections. From the general observation, there are two notable points. Firstly, we can see that most of the intersections in Fredericton City are the T junction (3-way intersection). Secondly, the 4-way intersection are mainly distributed in the downtown area.
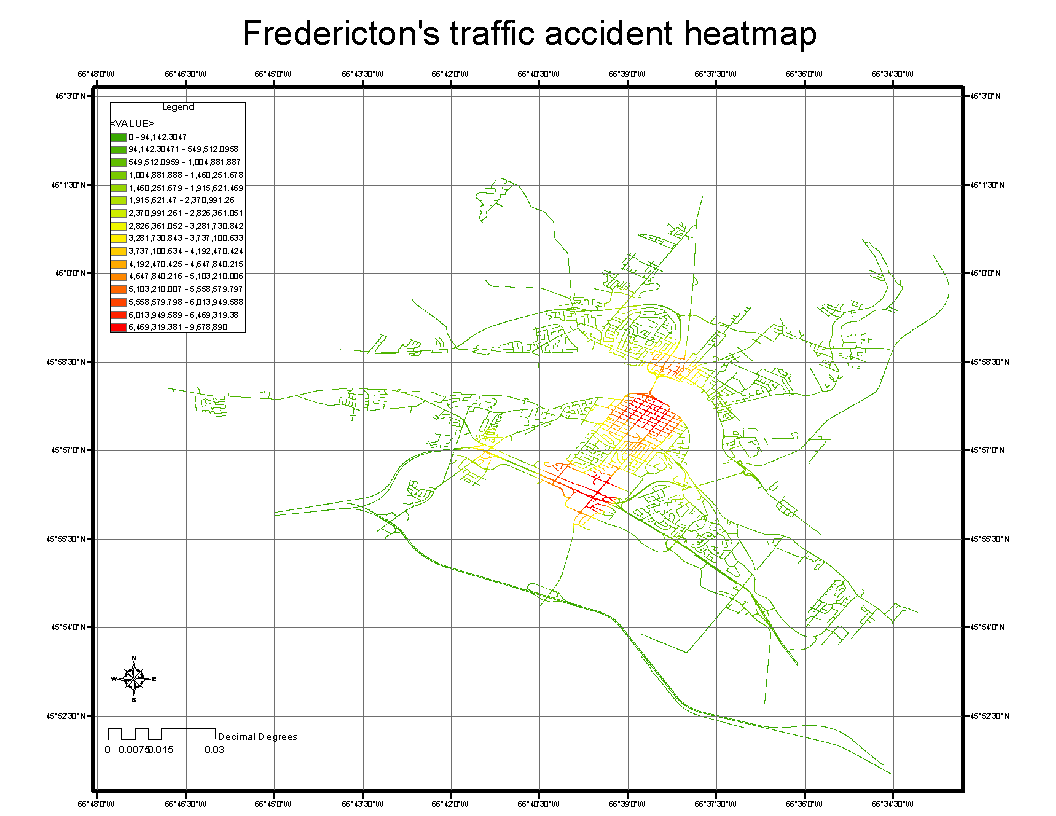
Task 5: The traffic accident data in Fredericton from 2007 - 2018 may useful for us to analyse to provide the warning information for the bus driver aiming to improve the safety of the transit service. Therefore, We created the heat map of traffic accident in the City of Fredericton by applying this data on the Street Line Centre of Fredericton City. To do that, we have used the Point Density tool for Spatial Analysis on the Street Line Centre layer in the Raster Analysis environment. As the results, the most dangerous areas are the downtown area and the uptown area closely to Prospect Street.
-------------------------------------------------------
Week 4
Data analysis
During this week, we used the data processing available from last week combining with the model builder to delve deep in the transit services in Fredericton City. Several aspects will be explored and analysed. In details, three main analytical tasks are performed:
- Analytical task 1: Exploring the bus service provided by Fredericton Transit.
- Analytical task 2: How accessibility can the bus service provide to passengers?
- Analytical task 3: Can we manipulate the data to provide the safety for the Fredericton Transit service?
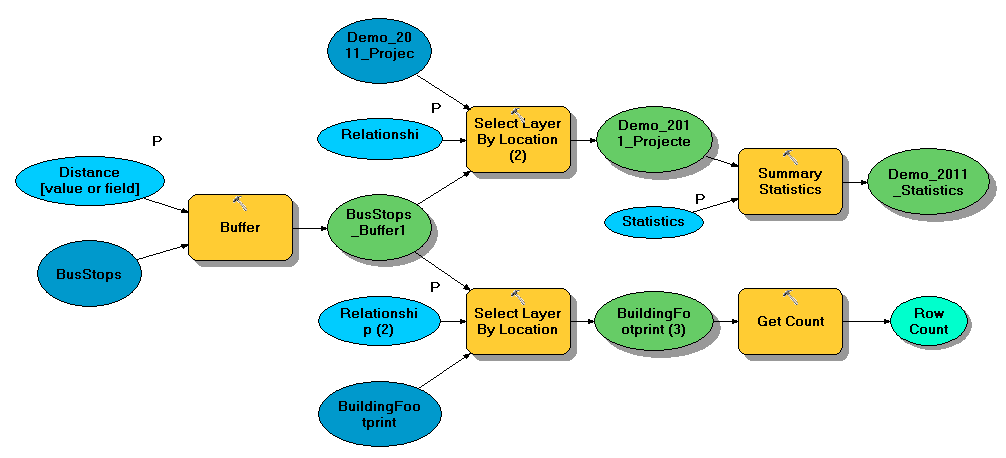
Analytical Task 1: To explore the bus service provided by Fredericton Transit, we used Bus Stops data, Demographic data, and Bulding Foot Print data as the input layers. Our purpose is to calculate how many buildings that can be covered by the bus service (e.g.: near the bus stops) and to compute the statistical information (using Demogriphic data) about the bus service allocated to people based on age, gender, and school enrollment. We built the model below to do that. Firstly, we create a buffer layer for the all bus stops in the city with the radius of 400 meters. Then we select all the buildings with the buffers and count how many buildings are covered by the bus stops buffer. Next, we also selected the demographic regions based on the bus stops buffer. Then you the statistic operation the create a statistical table for the information we need.
Result: The map below shows the coverage area provided by the bus services of Fredericton. In general, most of the important areas in Fredericton are corvered. Only serveral in surburb areas (in red circle) are not receiced the bus services.
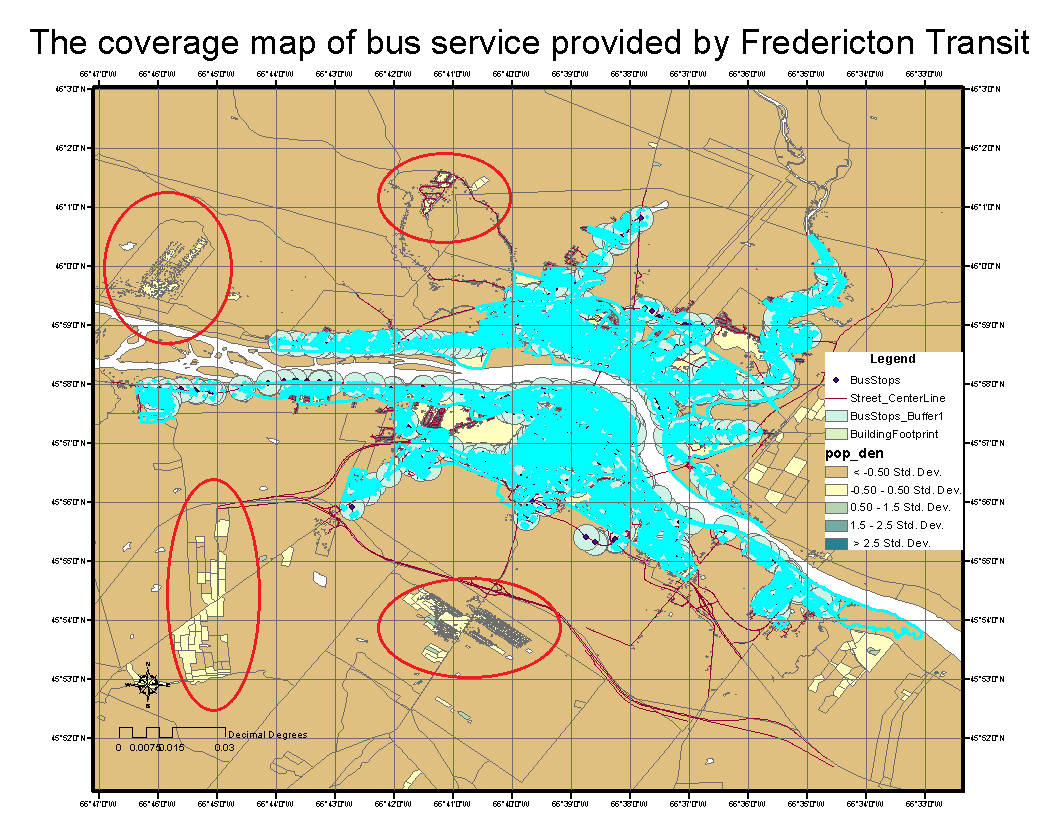
From analytical results, 21973 out of 30467 buildings are covered by the bus services, accouting for 72,12%. For the statistical results, the bus services provided by Fredericton Transit are only covered nearly a half of the population (See the Table).
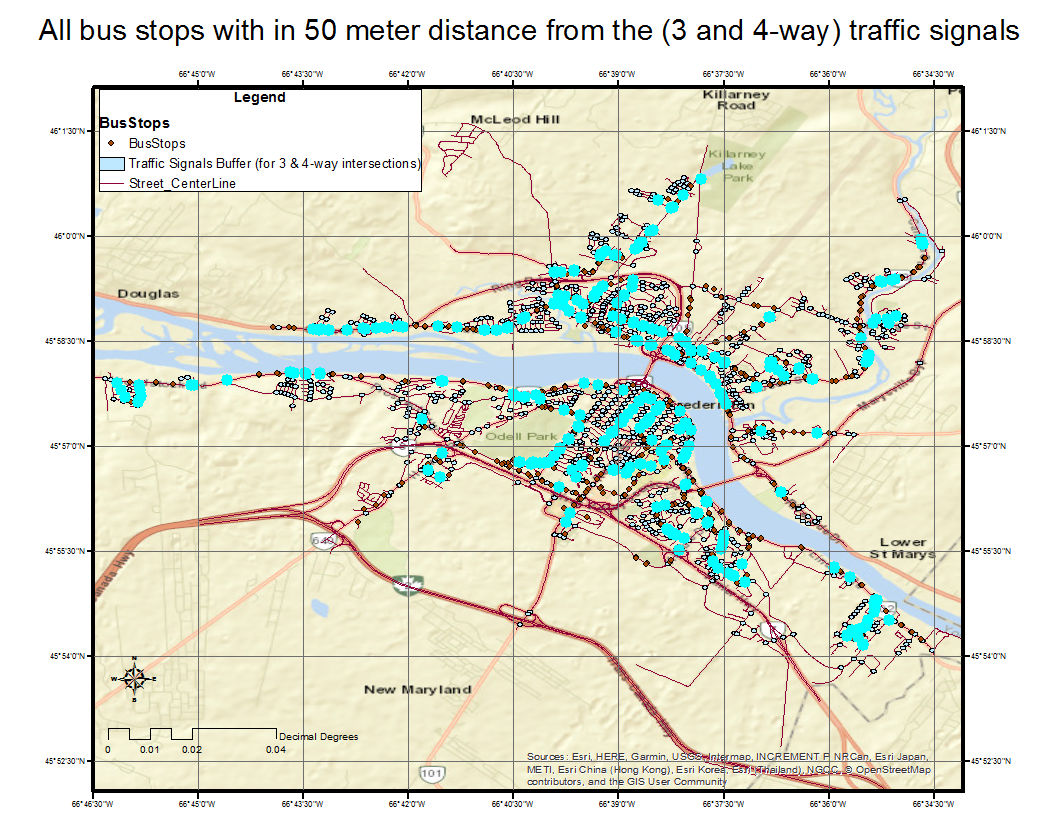
Analytical Task 2: Exploring how accessibility can the bus service provide to passengers? Our assumption is that if a bus stop locate close to an intersection, it is likely easier to access for people. Therefore, the purpose of this task is to measure how many percentage of the bus stops that are near the intersections. To do that, we build a model using the Traffic Signal data, and the Bus Stop data. We pay more attention to the intersections with more than 3-way. Hence, we select them use the SQL expression. Then, create the buffers on them with a 50 meters radius. Finally, we select all the bus stop with in the buffers and get count.
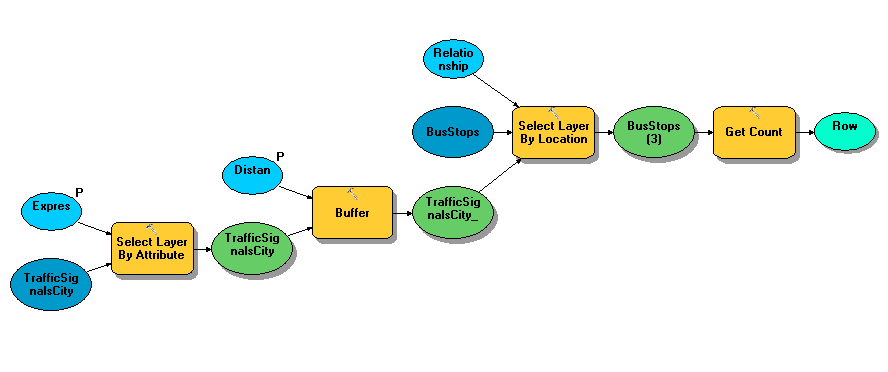
Results: We count totally 318 out of 808 bus stops closing to the intersections, accounting for 39.36%. The map below shows how accessibility of the transit services are.
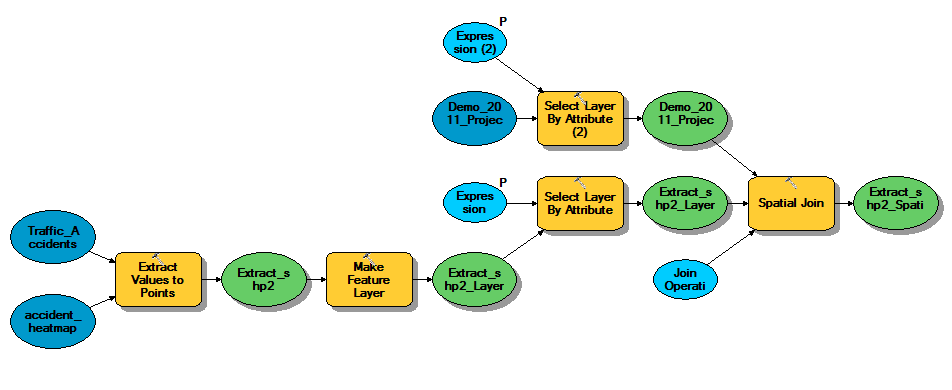
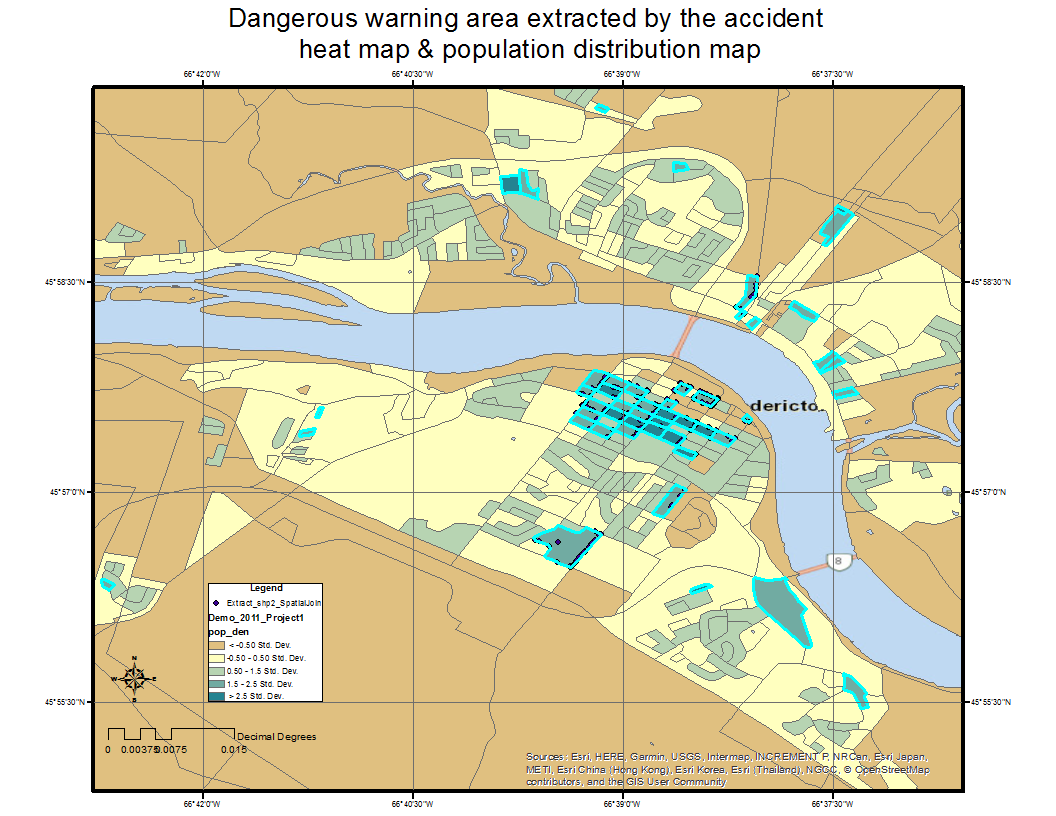
Analytical Task 3: To manipulate the data to provide the safety for the Fredericton Transit service, we use the Demographic data and Traffic Accident data. Looking back the results we have got from Task 3 & Task 4 last week (Week 3), we can found some similar patterns in the population distribution and traffic accident heatmap. Therefore, we use the raster heat map as the input layer to our model and extract high value to points. Then, circulating the dangerous regions with highly population distributed areas in the Demographic data and joining them to a unique spatial layer.
Results: By doing this analysis, we can create a map to warn the bus drivers whenever they approach these areas to in the safety feature of the bus service.
-------------------------------------------------------
Week 5
From the analytical results and finding from this project. There are still some room for the Fredericton Transit to improve there service. The KML file of our analytical tasks can be found here:
- KML file for the analytical task 1 [download]
- KML file for the analytical task 2 [download]
- KML file for the analytical task 2 [download]
Beside that, we also diseminate some of our results to the ArcGIS Online. Some of our example can be seen below:
ArcGIS online map showing the population of Fredericton: