Deliverables
Make a directory ~/cs2613/assignments/A6. Commit summarize.m, and
any test extra octave or csv files needed. Make sure you commit and
push all your work using coursegit before 23:59 on Thursday
December 7. For a detailed marking scheme see
octave-assignment.
Introduction
You are probably familiar with histograms, which count the number of items (e.g. students) in a given category (e.g. with a given grade). A common generalization to 2 dimensional data is the Spatial Heat Map. In the picture below, each square represents the number of Cholera deaths in a certain area of London in 1854.
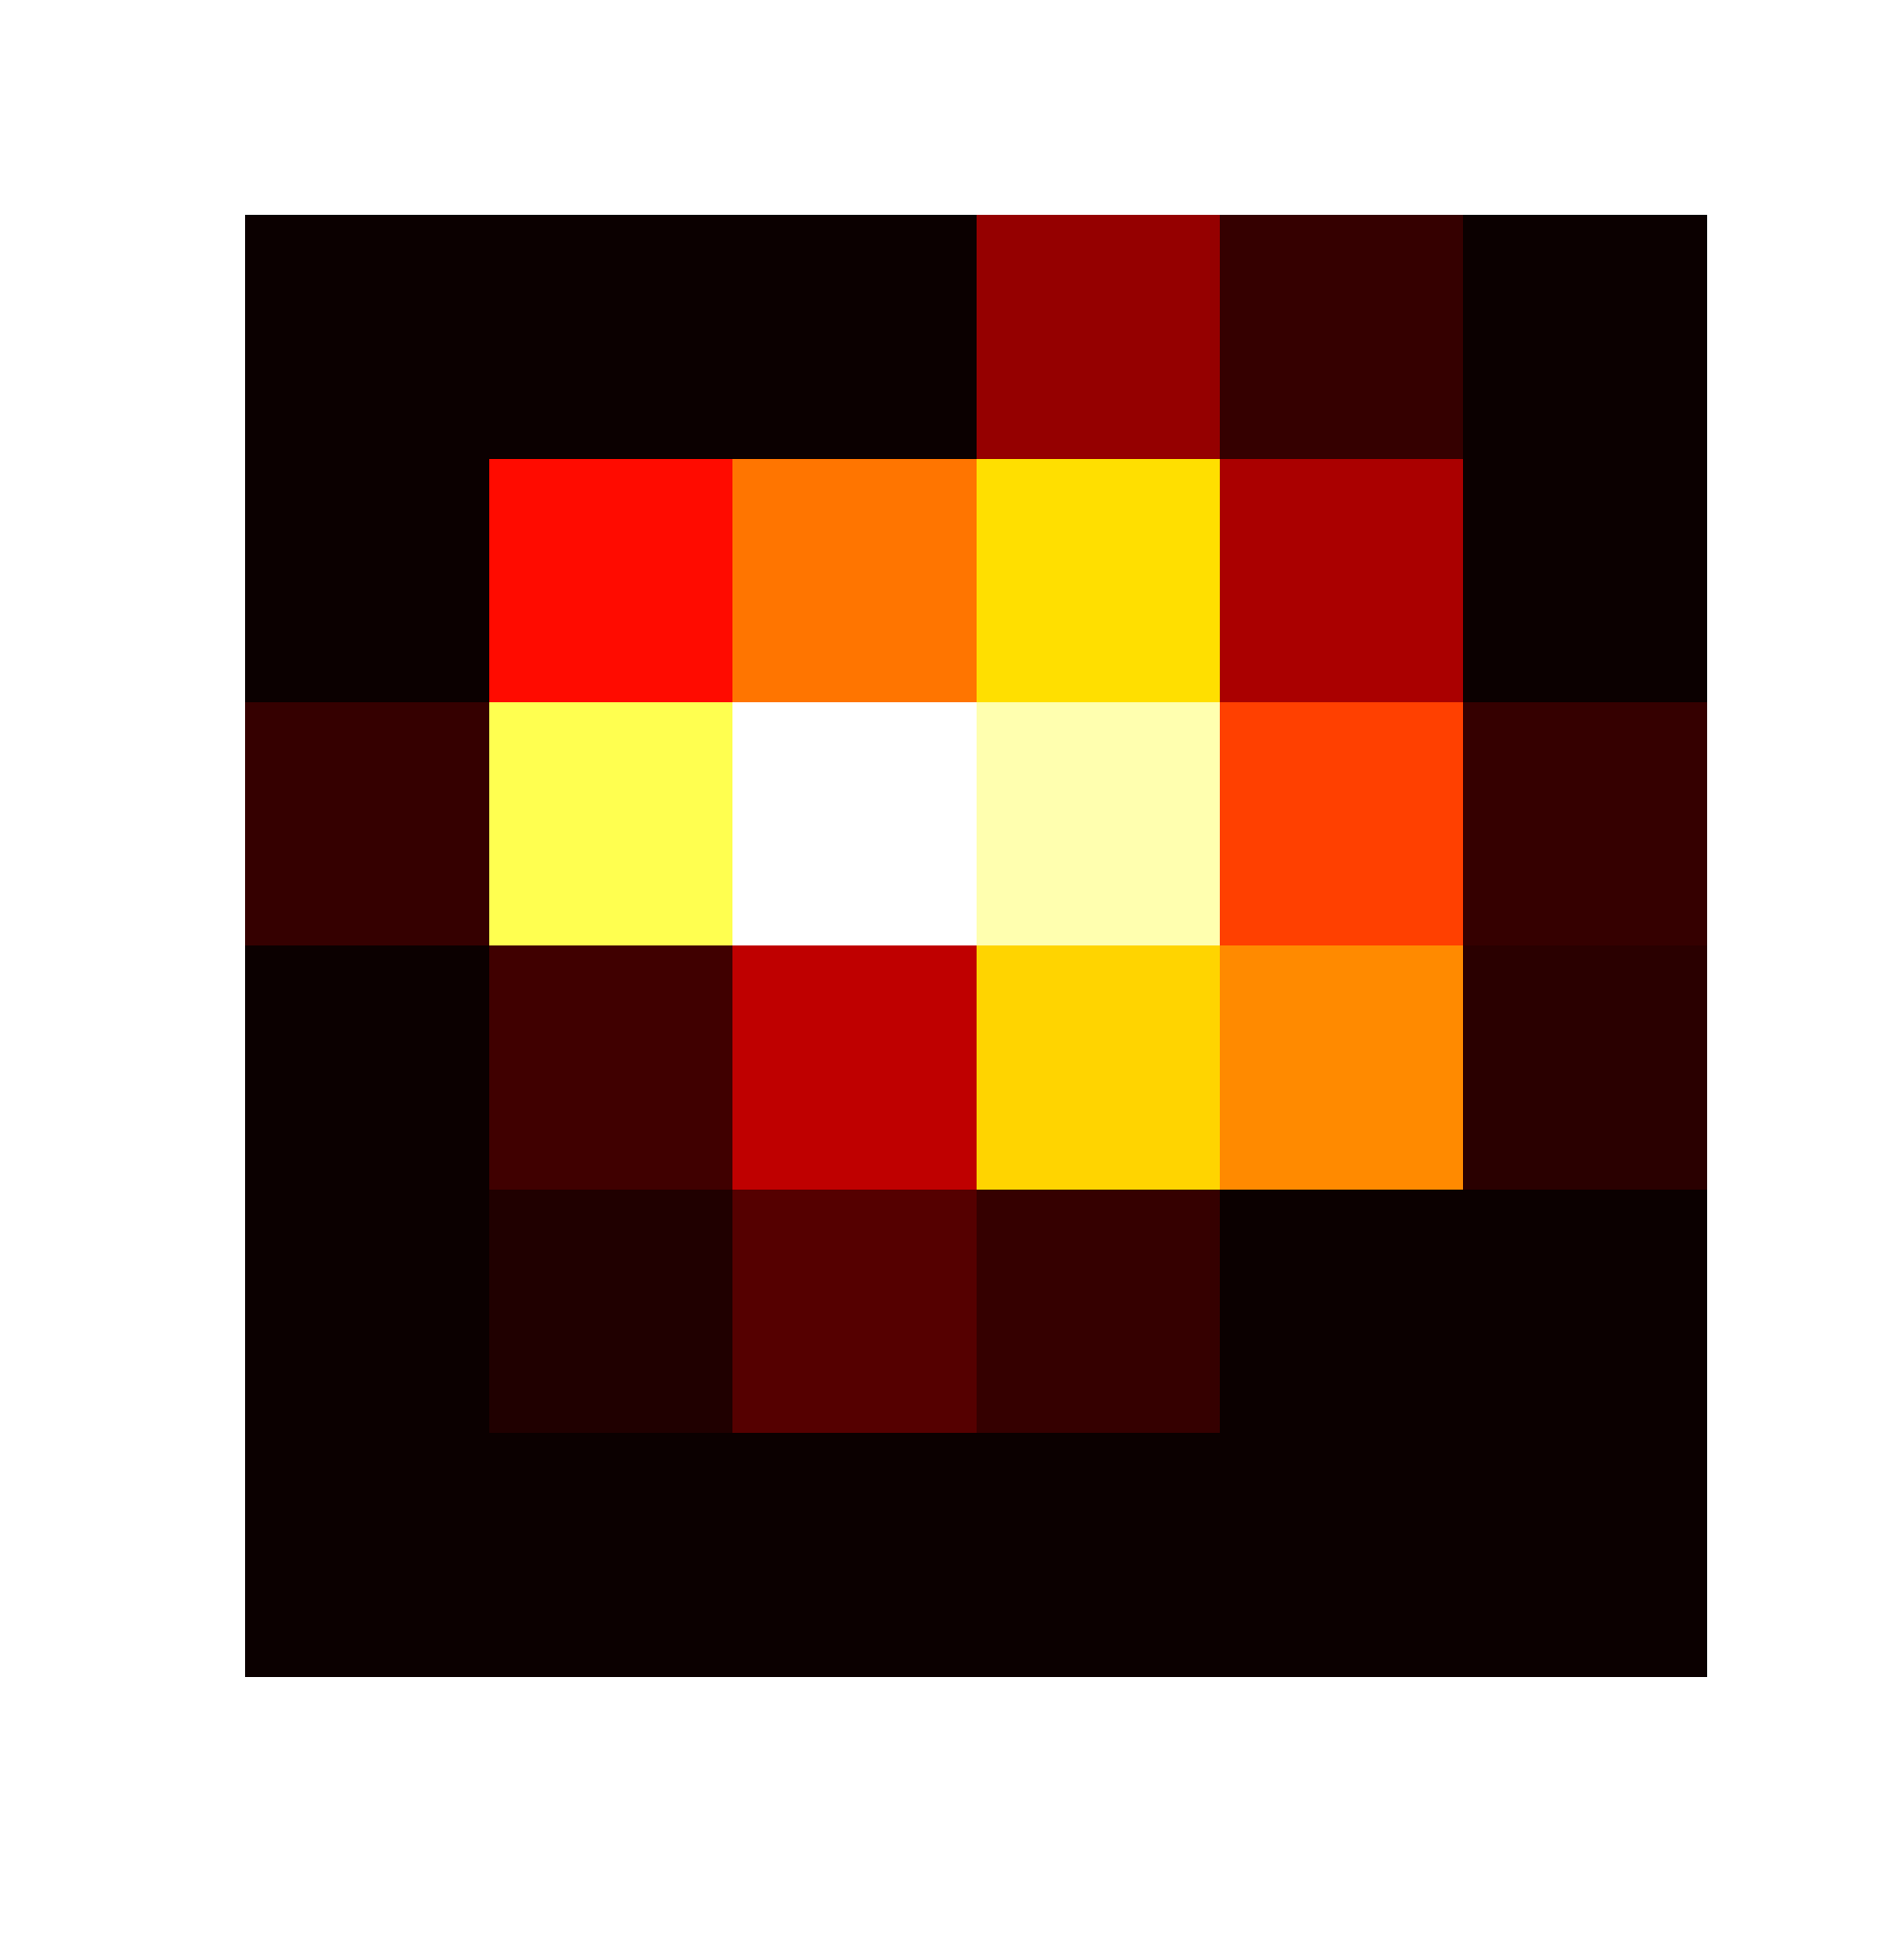 |
The white square is the most intense, with 67 deaths, while the black squares have none. Snow eventually realized that one particular pump (in the white square) was the source of a particular outbreak. While there is more to epidemiology than visualization, I think we can agree the picture is easier to interpret than the raw data.
What to do
The assignment is to write an octave function summarize that computes spatial
heat maps. In numerical form these are just matrices (2 arrays) where
each element contains the sum of all of the counts with coordinates in
a certain range. The picture above was generated by
imshow(summarize("cholera.csv",6,6), hot())
The corresponding matrix looks like
    0    1    1   14    5    0
    1   25   35   45   16    0
    5   53   67   59   30    5
    0    6   18   44   37    4
    0    3    8    5    1    0
    0    0    0    0    1    0
The second and third arguments of summarize are xsteps and
ysteps, telling how many columns and rows respectively the returned
matrix will have. The range of coordinates for each matrix element
can be found by dividing the total range of x (respectively y)
coordinates into the appropriate number of identical intervals.
You can read the input with csvread; make sure you tell it to skip the first row.
One goal of this assignment is to see how few loops you can use. Think about your function as a sequence of transformations of the input matrix (e.g. scaling it, or rounding to integers). Many of the transformations you need are simple matrix arithmetic (e.g. adding two matrices together).
Hint With some (constant) number of steps can transform the given matrix into a one where the second and third columns are the column and row index of the output cell. You can then use sparse or accumarray to generate the heat map.
Your function should pass the following tests; be careful about rounding. The test data is available from line.csv, simple.csv
%!assert (summarize("line.csv") == 123)
%!assert (summarize("line.csv", 3, 1) == [ 3, 20, 100 ])
%!assert (summarize("line.csv", 1, 3) == [ 3; 20; 100 ])
%!assert (summarize("line.csv", 5, 3) == [ 3,0,0,0,0; 0,0,20,0,0; 0,0,0,0,100 ])
%!assert (summarize("simple.csv") == 7654321)
%!assert (summarize("simple.csv", 4, 1) == [1, 54000, 600320, 7000000])
%!assert (summarize("simple.csv", 1, 8) == [1; 2e1; 0; 3e2; 4e3; 6e5; 5e4; 7e6])
%!assert (summarize("simple.csv",2,2) == [ 1, 320; 54000, 7600000 ])