I have been in the habit of using R to make e.g. histograms of test scores in my courses. The main problem is that I don't really need (or am too ignorant to know that I need) the vast statistical powers of R, and I use it rarely enough that its always a bit of a struggle to get the plot I want.
racket is a programming language in the scheme family, distinguished from some of its more spartan cousins by its "batteries included" attitude.
I recently stumbled upon the PLoT graph (information visualization kind, not networks) plotting module and was pretty impressed with the Snazzy 3D Pictures.
So this time I decided try using PLoT for my chores. It worked out pretty well; of course I am not very ambitious. Compared to using R, I had to do a bit more work in data preparation, but it was faster to write the Racket than to get R to do the work for me (again, probably a matter of relative familiarity).
#lang racket/base
(require racket/list)
(require plot)
(define marks (build-list 30 (lambda (n) (random 25))))
(define out-of 25)
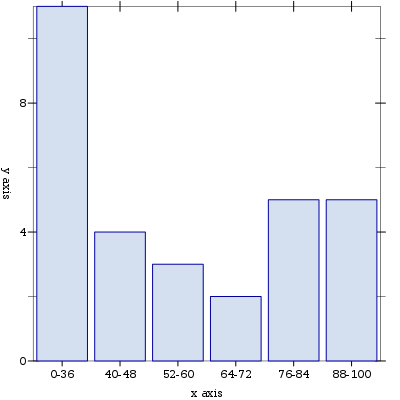
(define breaks '((0 9) (10 12) (13 15) (16 18) (19 21) (22 25)))
(define (per-cent n)
(ceiling (* 100 (/ n out-of))))
(define (label l)
(format "~a-~a" (per-cent (first l)) (per-cent (second l))))
(define (buckets l)
(let ((sorted (sort l <)))
(for/list ([b breaks])
(vector (label b)
(count (lambda (x) (and
(<= x ( second b))
(>= x ( first b))))
marks)))))
(plot
(list
(discrete-histogram
(buckets marks)))
#:out-file "racket-hist.png")